


Consumer Reports Car Reliability Survey 2015


Thread Starter
Lexus Champion
Joined: Apr 2011
Posts: 2,010
Likes: 0
From: CA
 Consumer Reports Car Reliability Survey 2015
I'm impressed by how well Audi's done for 3 years in a row. Their most reliable model is even more reliable than Lexus's most reliable model now. Quite a turnaround.
http://www.consumerreports.org/cars/...or-reliability
How Car Brands Compare for Reliability
Definitive ranking shows how the brands stack up
By Consumer Reports
Last updated: October 20, 2015
Ever wonder which company makes the most reliable cars? Thanks to the latest Consumer Reports’ 2015 Annual Auto Survey, there is a definitive answer.
Our 2015 auto survey, conducted last spring, gathered information from Consumer Reports subscribers who collectively owned or leased over 740,000 vehicles. From this data, we can predict how cars will hold up, and collectively, what the outlook is per brand.
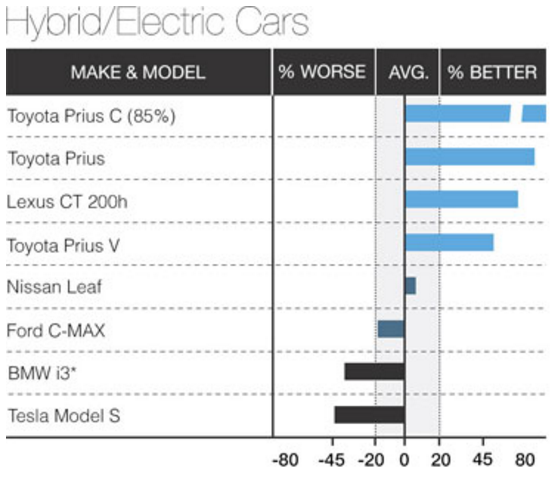
This table shows how the brands rank based on the average of their models’ predicted reliability scores. A measure of the brand’s consistency can be seen in the span of their scores, cross-referenced by how many different models they produce. The blue bars illustrate a brand’s consistency by showing the reliability range between its top and bottom model. The numerals indicate the number of models included. We excluded Jaguar, Land Rover, Mitsubishi, Scion, Smart, and Tesla because we lack data on two or more of their models.

http://www.consumerreports.org/cars/...or-reliability
How Car Brands Compare for Reliability
Definitive ranking shows how the brands stack up
By Consumer Reports
Last updated: October 20, 2015
Ever wonder which company makes the most reliable cars? Thanks to the latest Consumer Reports’ 2015 Annual Auto Survey, there is a definitive answer.
Our 2015 auto survey, conducted last spring, gathered information from Consumer Reports subscribers who collectively owned or leased over 740,000 vehicles. From this data, we can predict how cars will hold up, and collectively, what the outlook is per brand.
This table shows how the brands rank based on the average of their models’ predicted reliability scores. A measure of the brand’s consistency can be seen in the span of their scores, cross-referenced by how many different models they produce. The blue bars illustrate a brand’s consistency by showing the reliability range between its top and bottom model. The numerals indicate the number of models included. We excluded Jaguar, Land Rover, Mitsubishi, Scion, Smart, and Tesla because we lack data on two or more of their models.
Last edited by ydooby; Oct 22, 2015 at 10:31 AM.

how to interpret the x axis scale? or any of it? 
it's based on 'predicted reliability scores' of models for each brand, based on (up to) 740,000 survey responses (i think). but what is predicted reliability score based on in the survey? i guess if the person filling out the survey reports unreliability events for models.
if it's % better or worse than average, i guess that means a -100 is 100% worse than average, but what does that mean?
if car X, brand Y has 1 unreliability event and it turns out that's AVERAGE, then if car A, brand B has 2 unreliability events they're 100% worse than average, but that's absurd to look at it that way as it should be based on standard deviations.
but it makes for a scary chart.
it's based on 'predicted reliability scores' of models for each brand, based on (up to) 740,000 survey responses (i think). but what is predicted reliability score based on in the survey? i guess if the person filling out the survey reports unreliability events for models.
if it's % better or worse than average, i guess that means a -100 is 100% worse than average, but what does that mean?
if car X, brand Y has 1 unreliability event and it turns out that's AVERAGE, then if car A, brand B has 2 unreliability events they're 100% worse than average, but that's absurd to look at it that way as it should be based on standard deviations.
but it makes for a scary chart.
from here it says this:
it says 'over the years' so are the incidents based on the same models over multiple model years? what if a brand sold a lot more of a model in one year, with more problems, than another year, where they had less problems? that would skew the results dramatically over a car which started out selling slowly with lots of problems, but they got fixed and then the sales were higher in later years... the latter car would be reported as much more reliable, wouldn't it?
Consumer Reports’ reliability Ratings show how well vehicles have held up and the odds that an owner could be inconvenienced by problems and repairs. A vehicle's reliability can seriously affect how satisfied you'll be with a car over the years, and it can significantly influence resale value when you're ready to replace the vehicle. Consumer Reports surveys our magazine and website subscribers each year to ask about any serious problems they've had with their vehicles in the preceding 12 months. The latest large-scale survey collected detailed data on more than 740,000 vehicles, giving us a solid source for chronicling past reliability and predicting future performance.

Lexus Fanatic


Joined: Oct 2003
Posts: 94,430
Likes: 249
From: Virginia/D.C. suburbs
No system is perfect. But Consumer Reports has what is (arguably) the best system available for determining year-to-year reliability.
I have to agree with ydooby........Audi, a brand which was once known as a classic money-pit when out of warranty, has indeed done quite well the last few years, although if their American-market TDI diesels have to go back to correct emission issues because of the parent VW/Audi scandal, that might impact on future ratings.
Buick is also very impressive....clearly the top domestic American-badge, and with all five of the models average or above. But, I think one reason for Buick's good showing is that the Verano and Regal (which CR gives very good reliability ratings to) are not true American Buicks in the classic sense, but rebadged German-designed Opel vehicles with GM powertrains and extra sound insulation. Buick's upcoming Cascada convertible will also be a rebadged Opel. Opel has lately achieved a good reputation for quality and solidness, though it shows up in vehicle weight. Buick's small Encore SUV also shares in the Opel source, but to a lesser extent.
And, of course, I don't have to expound on the obvious..........what will happen to VW's numbers next year, from emissions-work required on diesels, will be anybody's guess.
I have to agree with ydooby........Audi, a brand which was once known as a classic money-pit when out of warranty, has indeed done quite well the last few years, although if their American-market TDI diesels have to go back to correct emission issues because of the parent VW/Audi scandal, that might impact on future ratings.
Buick is also very impressive....clearly the top domestic American-badge, and with all five of the models average or above. But, I think one reason for Buick's good showing is that the Verano and Regal (which CR gives very good reliability ratings to) are not true American Buicks in the classic sense, but rebadged German-designed Opel vehicles with GM powertrains and extra sound insulation. Buick's upcoming Cascada convertible will also be a rebadged Opel. Opel has lately achieved a good reputation for quality and solidness, though it shows up in vehicle weight. Buick's small Encore SUV also shares in the Opel source, but to a lesser extent.
And, of course, I don't have to expound on the obvious..........what will happen to VW's numbers next year, from emissions-work required on diesels, will be anybody's guess.


Trending Topics

fun thing, 'statistics'.

Lexus Fanatic


Joined: Jan 2005
Posts: 20,238
Likes: 274
how to interpret the x axis scale? or any of it?
it's based on 'predicted reliability scores' of models for each brand, based on (up to) 740,000 survey responses (i think). but what is predicted reliability score based on in the survey? i guess if the person filling out the survey reports unreliability events for models.
if it's % better or worse than average, i guess that means a -100 is 100% worse than average, but what does that mean?
if car X, brand Y has 1 unreliability event and it turns out that's AVERAGE, then if car A, brand B has 2 unreliability events they're 100% worse than average, but that's absurd to look at it that way as it should be based on standard deviations.
but it makes for a scary chart.
it's based on 'predicted reliability scores' of models for each brand, based on (up to) 740,000 survey responses (i think). but what is predicted reliability score based on in the survey? i guess if the person filling out the survey reports unreliability events for models.
if it's % better or worse than average, i guess that means a -100 is 100% worse than average, but what does that mean?
if car X, brand Y has 1 unreliability event and it turns out that's AVERAGE, then if car A, brand B has 2 unreliability events they're 100% worse than average, but that's absurd to look at it that way as it should be based on standard deviations.
but it makes for a scary chart.
Well, imagine average is 100.
Brand with +50% has 50 problems on average, while one with -50% have 150 problems on average.
So the difference is quite large between the two.
Lexus Fanatic
Joined: Jan 2005
Posts: 20,238
Likes: 274
Lexus Fanatic
Joined: Jan 2005
Posts: 20,238
Likes: 274


Driver
Joined: Mar 2007
Posts: 186
Likes: 2
From: CA
In all the Reliability Surveys, there is really only one brand/manufacture on top, all others around there are totally different or jump up/down year from year according to each media. 
It is unbelievable that some Audi/ BMW models are better than the very best Lexus in Reliability , while Mercedes is close to the bottom of the chart. I know that people can have hundreds of excuses to explain it, but it is just too far from my own experience.
It is unbelievable that some Audi/ BMW models are better than the very best Lexus in Reliability
, while Mercedes is close to the bottom of the chart. I know that people can have hundreds of excuses to explain it, but it is just too far from my own experience.

Pole Position
Joined: Mar 2015
Posts: 258
Likes: 1
From: WA
Front Page News!
Good stuff! Here's my front page take on it...
https://www.clublexus.com/articles/c...shes-on-tesla/
https://www.clublexus.com/articles/c...shes-on-tesla/